Lab 4 Terrain and Hydology Analysis
Written by Hana Travers-Smith
Lab Overview
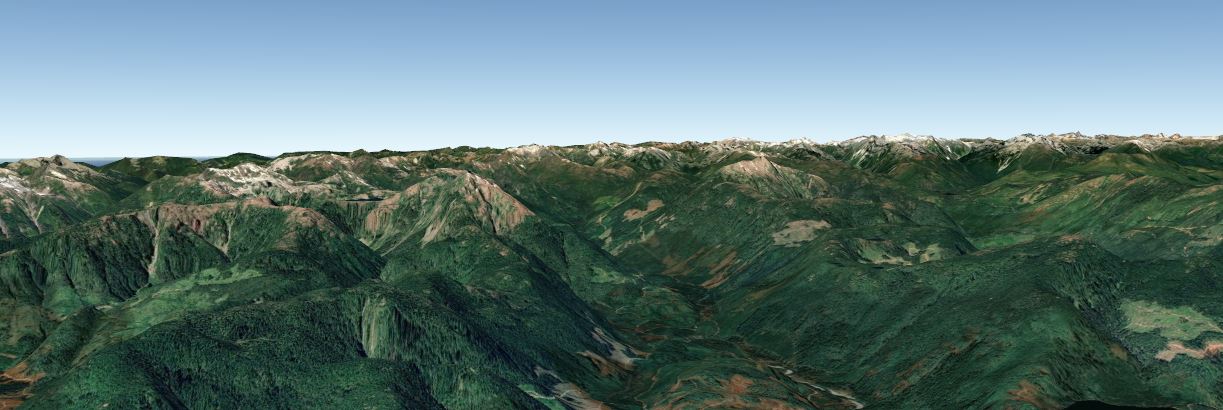
A Digital Elevation Model (DEM) is a digital representation of the Earth’s terrain including mountains, valleys, rivers, and other topographic features. They are typically created using remote sensing technology, such as radar or LiDAR (Light Detection and Ranging), which capture elevation data points across the landscape. Typically, these elevation data points are organized into raster format, where each raster cell represents elevation within specific pixel. DEMs are used in a range of applications, including cartography, hydrology, geology, environmental analysis, and simulating water flow and erosion.
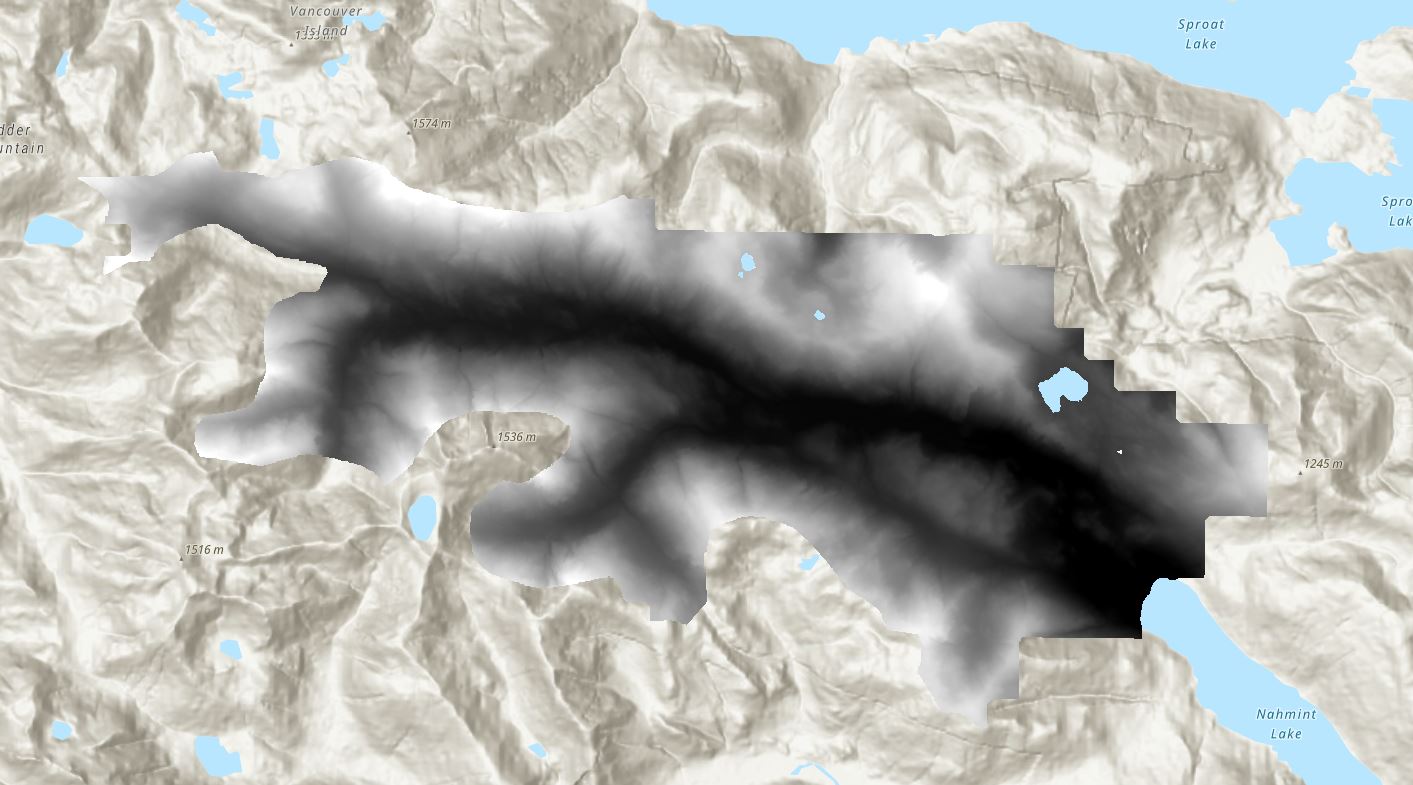
In this lab you will use a DEM and the Hydrology toolset in ArcGIS Pro to map stream networks and watersheds within critical salmon spawning habitat in Nahmint, BC.
Learning Objectives
Understand how data is represented in a DEM
Learn how to derive slope, aspect and Topographic Position Index (TPI) using raster focal calculations
Use the Hydrology Toolbox to map stream networks and watershed boundaries
Task 1: Understanding DEMs
Step 1: Create a new ArcGIS Project name it Lab4 and save it to the default directory. Import the Nahmint_DTM.tif and examine the Source information (right-click on the layer in the Catalog pane).
Q2. What is the Pixel Type and Pixel Depth? How many possible values can be represented by this data? (Report answer as an exponent.)
Q3. What is the difference between a signed and unsigned integer? Which would represent elevation best and why?
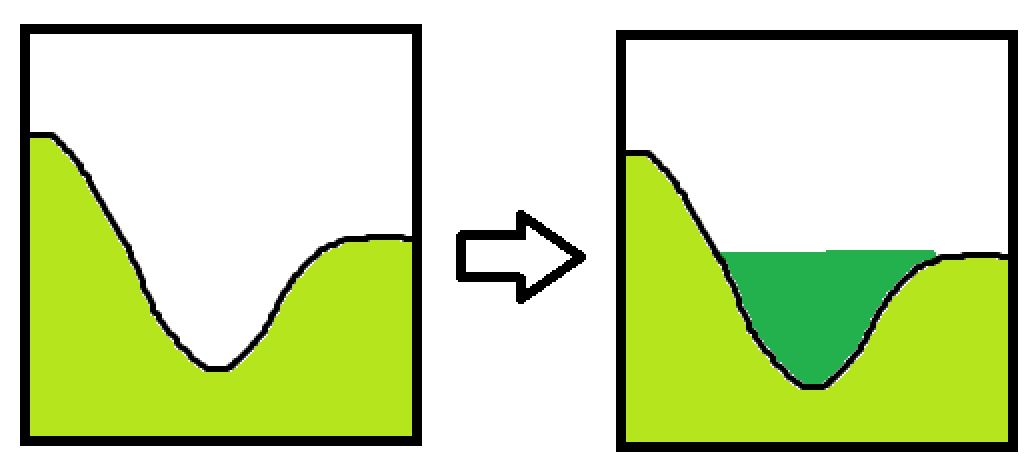
Step 2: First, we will use the Fill tool to remove any sinks from the DEM. Sinks are small imperfections in the DEM that create areas where water cannot flow out of. The image below shows the side profile of sink and how its gets filled by the Fill tool. If sinks are not eliminated, water flow can get trapped within these depressions, leading to unrealistic pooling of water and incorrect delineation of watershed boundaries.
Navigate to Analysis > Tools > Fill (Spatial Analyst).
- Input Surface Raster: Nahmint_DTM.tiff
- Output Surface Raster: Nahmint_fill
- Z limit: leave blank
Save the output to the default file path (in your ArcMap project).
The Z-limit represents the minimum depth of sinks that will be filled. For example, if it is set to 10m then only sinks deeper than 10m will be filled. For now leave this field blank, this will fill all sinks in the data.
Task 2: Identifying Stream Networks
Step 1: Next we will use the Flow Direction tool to to calculate the direction of water flow across the landscape.
There are three flow modelling algorithms, but we will use the simplest: D8. In this model water will flow from one cell its steepest downslope neighbour. The cell will then be assigned a value based on which of its 8 neightbours water will flow into.
Q5. The following raster shows elevation above sea level. What is the flow direction from the centre cell? Report your answer in terms of cardinal direction (North, South, Northwest etc)

Use the ArcGis help page to answer to following question: https://pro.arcgis.com/en/pro-app/latest/tool-reference/spatial-analyst/flow-direction.htm
Q6. If a cell is assigned a Flow Direction value of 32, what cardinal direction is water flowing out of the cell?
Navigate to Tools > Search Flow Direction
- Input surface raster: Nahmint_fill
- Output flow direction raster: Nahmint_FlowDir
- Flow Direction Type: D8
- Leave the rest blank/unchecked
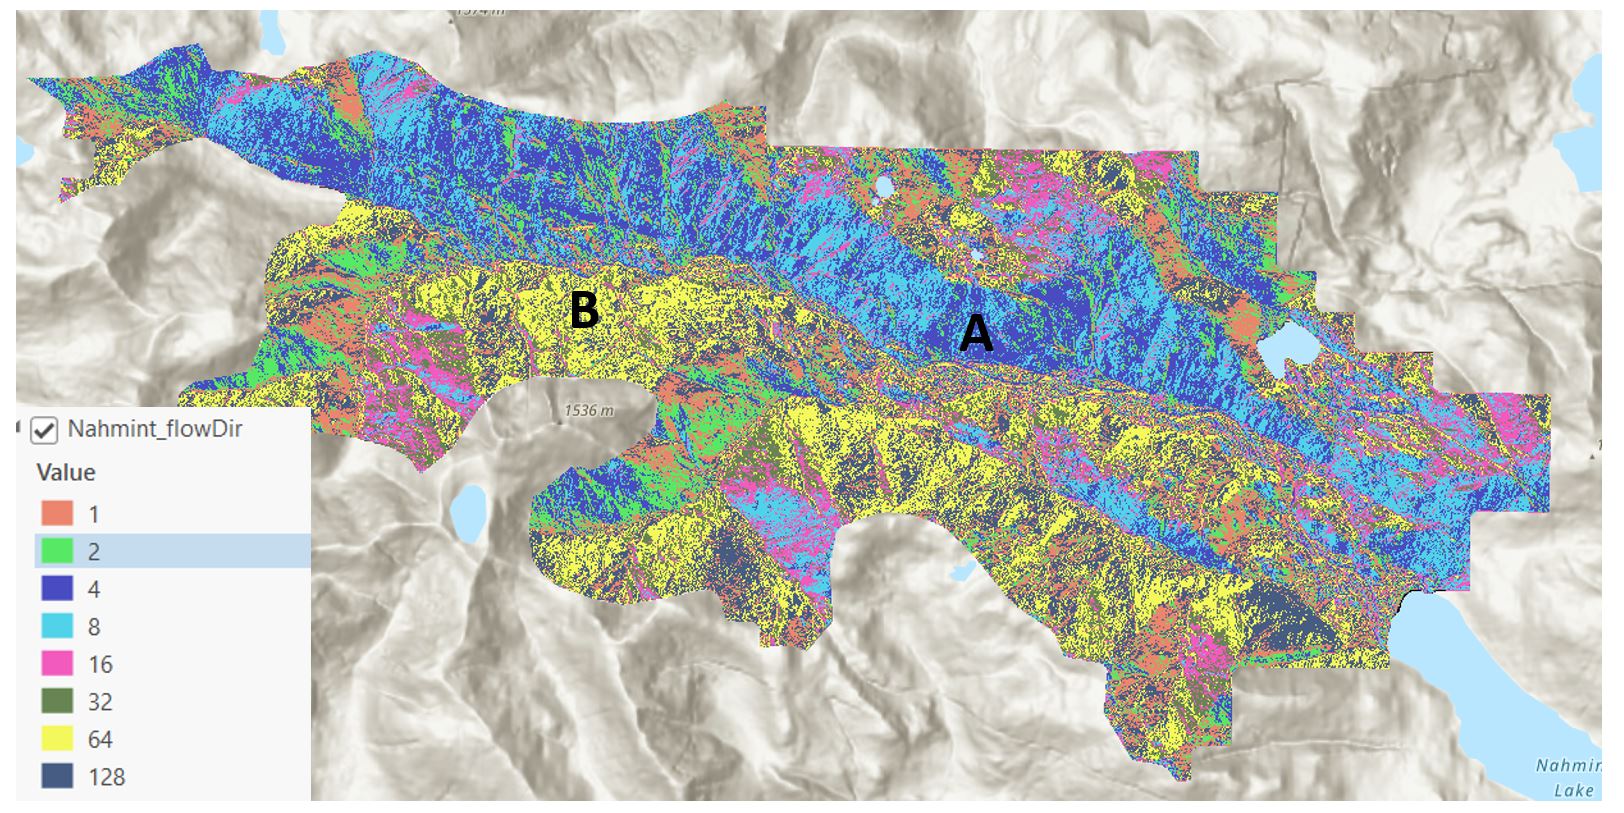
Click Run. You should now have something like the following:
Q7. For the areas marked A and B, approximately what direction is water flowing?
Step 2: We will use the flow direction raster calculated in the last step to calculate flow accumulation, which counts the total number of cells that will flow into each cell. For example, a cell located at the bottom of the hill will have high flow accumulation and a cell at the top of a hill will not have any flow accumulation.
Navigate to Analysis > Tools > Flow Accumulation
- Input flow direction raster: Nahmint_FlowDir
- Output flow accumulation raster: FlowAcc
- Output data type: Integer
- Input flow direction type: D8
Leave all other fields blank. > Run.
Step 4: Next, we will create a raster based stream network using a threshold in the flow accumulation raster. For example, if the threshold is 100, then only cells with flow accumulation greater than 100 will be counted as a stream. Cells with flow accumulation less than 100 will be set to a background value of 0.
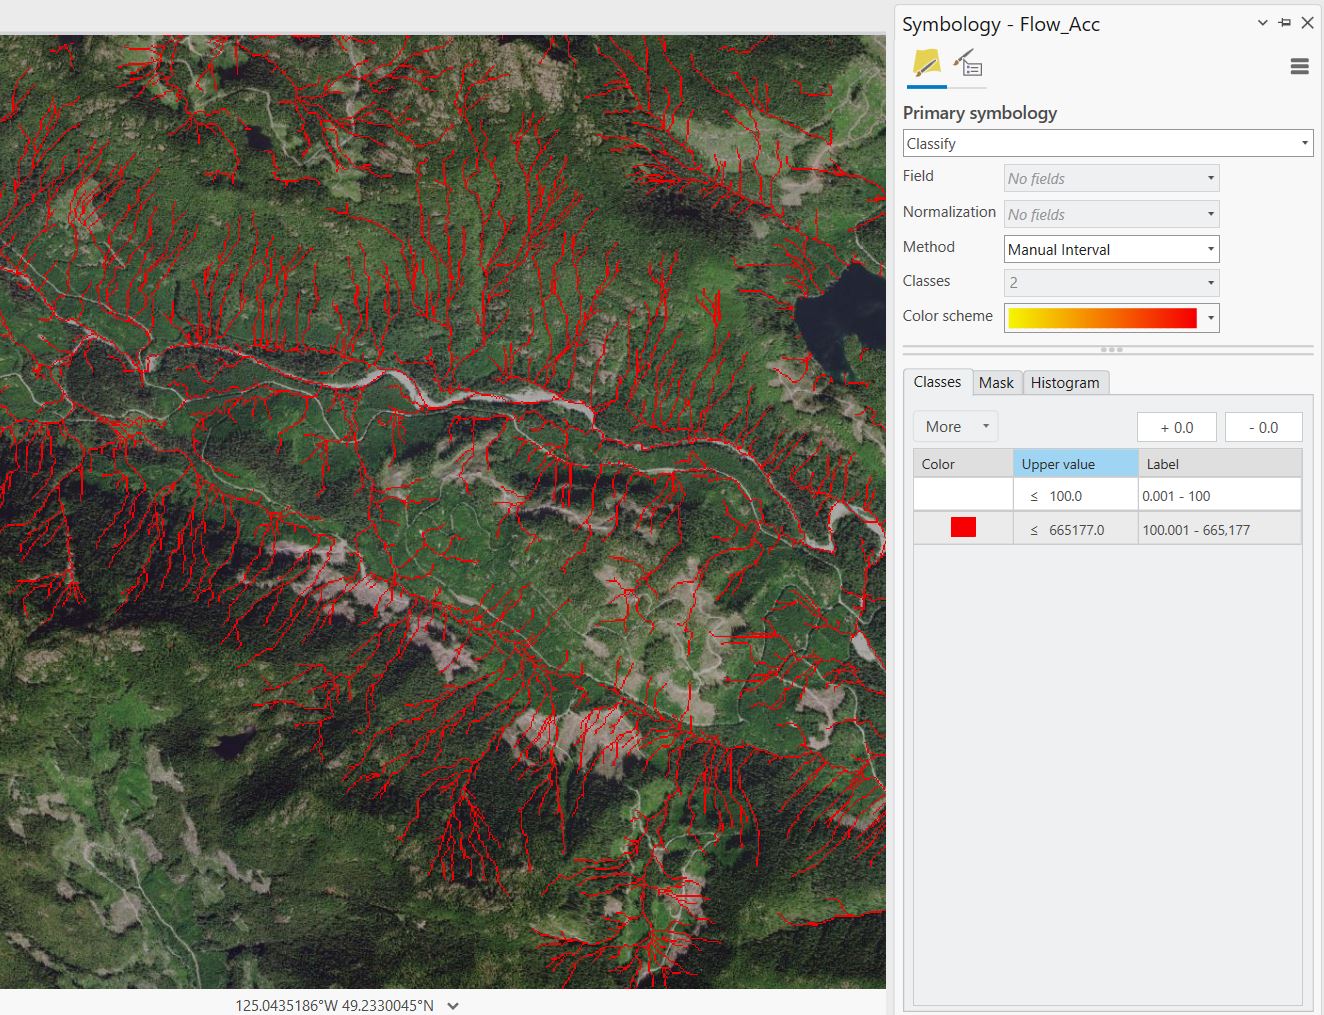
To see how different thresholds impact stream identification, change the Symbology of the flow accumulation raster and use the Manual Interval symbology to set two classes. See the example below for a stream network with a flow accumulation threshold of 100 (cells with flow accumulation < 100 are set to no color).
Q8: How does the stream network change if you change the threshold from 10, 1000 or 3000? Include a screenshot of each stream network using the different thresholds.
Q9: Compare your stream network to the streams visible in the ArcGIS satellite basemaps. Experiment with different flow accumulation thresholds. Which one seems to represent major streams in the satellite basemaps best? What other land cover/infrastructure in this region may make it difficult to verify smaller stream networks?
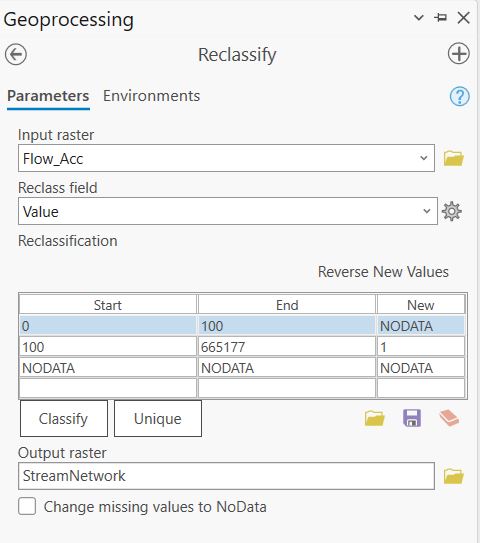
Once you have selected a threshold, navigate to the Reclassify (Spatial Analyst Tools) tool. Use the threshold you have selected as the start and end values. Set the cells representing streams to a new value of 1 and all other cells to NO DATA.
Save the new raster as StreamNetwork
Step 5: Finally, we will use the Stream to Feature (Spatial Analyst Tools) tool to create polyline features representing our stream network. THis tool uses the stream network and the flow direction layers. See this ArcGIS help page for more information: https://pro.arcgis.com/en/pro-app/latest/tool-reference/spatial-analyst/stream-to-feature.htm
Navigate to Analysis > Tools > Stream to Feature
- Input stream raster: StreamNetwork
- Input flow direction raster: Nahmint_FlowDir
- Output polyline features: StreamNetwork_lines
- Simplify polylines: Checked
Task 3: Mapping Watersheds
A watershed is an area of land where all the water that falls or flows into it converges to a common outlet, such as a river, lake, or ocean. It is bounded by a topographic or drainage divide, which separates water flowing into different basins. In this task we will delineate the boundaries of the Nahmint watershed.
The watershed tool uses flow direction and stream links to delineate watershed boundaries. Stream links represent the individual stream segments that make up the entire network. The watershed boundaries will be defined such that water flows into each of the stream links.
Step 1: First, we will use the Stream Link tool to generate the links. Use the raster stream network and the flow direction raster as the inputs. Save the new raster as StreamLinks > Run.
Step 2: Navigate to Analysis > Tools > Watershed
- Input D8 flow direction raster: Nahmint_FlowDir
- Input raster or feature pour point data: StreamLinks
- Output raster: Nahmint_watersheds
The output will be a new raster where the cell values correspond to each unique watershed catchment.
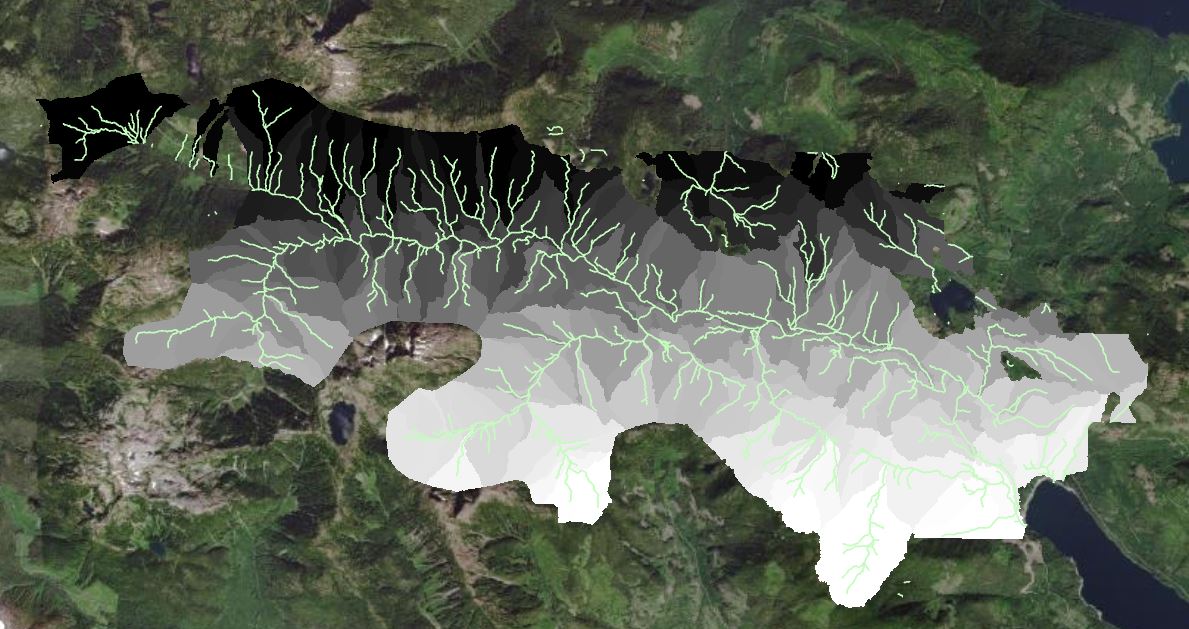
Q10: How many unique watersheds did you define? What is the area of the largest watershed area? Report your answer in km2 and round to 2 decimal places. HINT: Examine the raster attribute table to estimate watershed area.
Step 4: Create a map and include it in the final deliverables. The map must have the following elements:
- Stream network polylines
- Watershed polygons - assign different colors to each polygon
- Title
- North arrow
- Scale bar
- Legend