Lab 4 Collecting and processing GNSS data
Written by Paul Pickell
Lab Overview
Oftentimes, you will need to collect and display your own data. There are many phone applications to collect your own GNSS data. In this lab, you will plan your own GNSS collection, collect data, and process the data.
Task 1: Preparing for GNSS Data Collection
Field data collection is an important skill set to learn and practice. In this task, you will plan the collection of your GNSS data in a public park. The task for collecting GNSS data in a public park has nearly the same risks as if you collected the data on campus and you are expected to take similar precautions. This section is meant to inform you of the likely hazards and how to stay safe.
Planning Your Data Collection
Safety starts at the planning stage. When planning which park you will visit, consider somewhere nearby that is easily accessible by transit or walking. Avoid going somewhere that is unfamiliar to you. Ensure that you are visiting a public park and stay off of private or restricted property. You should only visit the park during daylight hours and plan to go out in sunny weather only. Check government websites for any recent animal sightings before you commit to going to your desired park. Do not plan to collect your GNSS data near bodies of water (e.g., oceans, lakes, ponds, rivers, streams). Do not plan to collect your GNSS data near cliffs or on steep terrain. Finally, ensure that you will have good cell phone coverage in case of an emergency.
Likely Hazards
At all times, you must be aware of possible hazards both overhead and underfoot. The main overhead hazard in a public park is going to be trees and falling branches. Do not collect your GNSS data during windy or stormy weather, which may cause tree branches to fall. Wet and slippery surfaces, steep angles, holes, logs, debris, and loose soil all pose fall hazards. Many of these hazards can be avoided with careful planning before you even step outside. Speaking of stepping, make sure you wear appropriate footwear, closed toed shoes are best for this work. Fauna are natural inhabitants of parks. Do not visit parks with recent sightings for large, predatory fauna such as bears or cougars. Even urban parks like Stanley Park in downtown Vancouver are known to have coyotes who have attacked people. As well, avoid areas with hazardous flora that may be thorny or poisonous. You may need to cross or transit streets to reach your park. Always follow local traffic laws and look for moving vehicles in and around your park. Always use designated crosswalks and do not look at your phone when walking near stopped or moving vehicles.
Do not collect your GNSS data while walking and looking at your phone. Always be aware of your surroundings.
Important: If you feel uncomfortable undertaking this task, please contact the instructor for alternative arrangements or accommodations for this particular assignment
All studies require a study area—for this lab, you will decide on your own study area through your own knowledge and simple remote sensing.
Your study area must:
- Be somewhere that you can legally and safely visit
- Be a park or a greenspace
- Have at least a portion of its ground visible using aerial imagery (e.g. Google Earth or an ArcGIS Pro basemap)
Step 1: Open ArcGIS Pro and turn on an imagery basemap (Map > Basemap > Imagery). Navigate to your proposed study area. You can do this by (a) dragging around your map, (b) putting coordinates into Go To XY, (c) typing in an address or park name into the Locate tool.
Before physically visiting your study area, you will need to verify that there are usable reference points in your chosen park. The reference points should be immovable, viewable from the sky and ground, and not tall (not trees or buildings). Additionally, you will be walking to your points – so they should be somewhere safely accessible and not too close or too far from each other.
Step 2:Find at least four possible reference points (all at least 10 m from each other). You will create a new shapefile and populate it with these reference points. In Geoprocessing, find the Create Feature Class tool by searching for “Create Feature Class”. Save it to a findable location and give it a meaningful name (for this lab, it will be called “refpoints”). For the other options:
- Geometry Type: Point
- Has M: No
- Has Z: No
- Coordinate System: –Local UTM–
- Click “Run”
Your new shapefile should now be in the “Contents” Pane, but it has no points.
Choose Edit from the top ribbon, then select “Create.” On the right, a “Create Features” pane will appear. In there, click refpoints, then select “Create a Point Feature.” Zoom in closely on the basemap before creating point features so that the points are more accurate. Click on (at least) four reference points, then select “Save” from the Edit ribbon. If you need to Move a reference point, you can select Move from the Edit Tools.
Open the attribute table of refpoints and add three new columns: Name, East, North. Populate the columns for each reference point: Name – a unique name. East – Easting. North – Northing. Easting and Northing can be populated using “Calculate Geometry.” For more relatable measurements in your precision and accuracy assessment (Task 3), use your local UTM for the geometry. Be sure to save your edits.
Step 3: You will be exporting a georeferenced map of your study area. Zoom in (or out) to an extent that contains at least the entire park.
INCLUDE THE MAP IN YOUR FINAL DELIVERABLES - BE SURE TO INCLUDE THE FOLLOWING ELEMENTS ON THE MAP (10)
Elements to include on the map: - Reference points - Inset map showing location of study area within Vancouver - Scale bar, north arrow, legend, title.
Q1: Provide a description of each reference point - what is it?(2)
Using the top ribbon, select Share > Export Map. A pane will pop up on the right-hand side of your screen. The file type is PDF, and make sure that it is saved somewhere you will be able to find it.
Toward the bottom of the pane, make sure that the box under “PDF Settings” that says “Export georeference information” is selected. Then select export. This will be used when you are collecting data with Avenza.
Step 4: Now that you have established a study area, you need to decide when you will be collecting your data. There are times in the day where you are more likely to get accurate GNSS readings. Find the coordinates of your study area so that you can use them in the Trimble GNSS Planning Online website (http://www.gnssplanning.com/).
Go to the Trimble GNSS Planning Online website and enter your study area’s coordinates (one set of coordinates from anywhere within the study area) and elevation. If your coordinates are not in the proper units, either convert them to the proper units. Choose the day that you plan to visit your field site and collect data.
After you have input your information into Settings, click “Apply” and look through the other tabs (Satellite Library, Charts, Sky Plot, World View).
On the Charts tab take a screenshot of the Number of Satellites and Iono Information charts - INCLUDE IN FINAL DELIVERABLES (2)
Task 2: Collect GNSS Data
You will need either an Android or iOS smartphone capable of installing the Avenza Maps App. If you do not have an Android or iOS smartphone, then please contact the instructor for alternative arrangements or accommodations
Step 1: To start you will need to install Avenza Maps App on your phone. There is an Android version as well as an iOS version so just go to your app store and download it. It’s free!
Step 2: Once you have the app installed on your phone, you need to sign up for a free account. If you have concerns about your privacy, you can use a pseudonym and your student UBC e-mail address.Avenza Maps is a widely used mobile mapping application, so chances are you might continue to use it in the future for other projects or hobbies. If you want to ensure future access to your Avenza Maps account and assets, then choose an e-mail account that you will continue to have access to (i.e., not your UBC student e-mail).
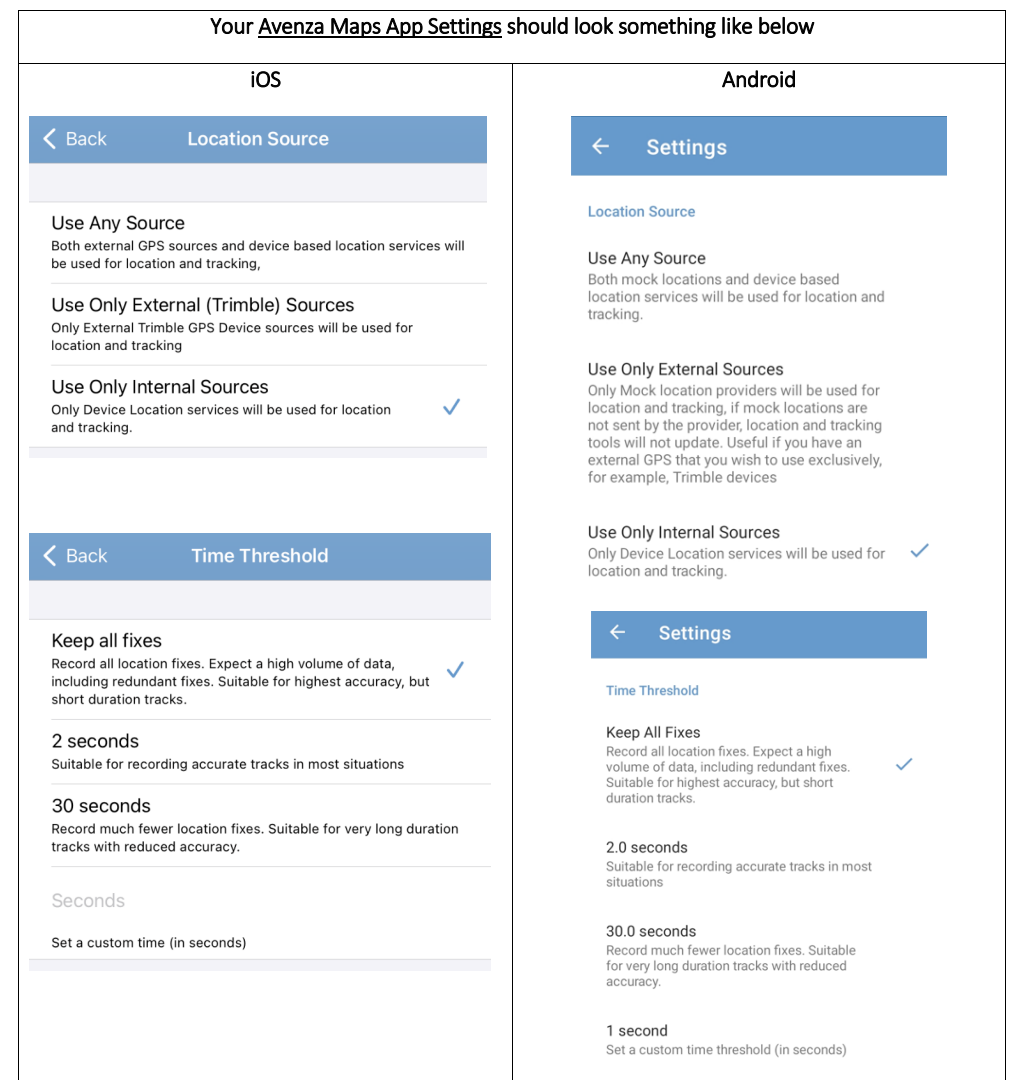
Step 3: Now that you are registered and logged in, you will change some settings in the Avenza Maps app. Navigate to the Settings in the bottom right corner (for iOS) and in the top right corner (for Android). Scroll down and click “GPS settings”. Use the following settings:
Location Source: “Use Only Internal Sources”. This ensures that we are only using the phone’s internal GNSS receiver.
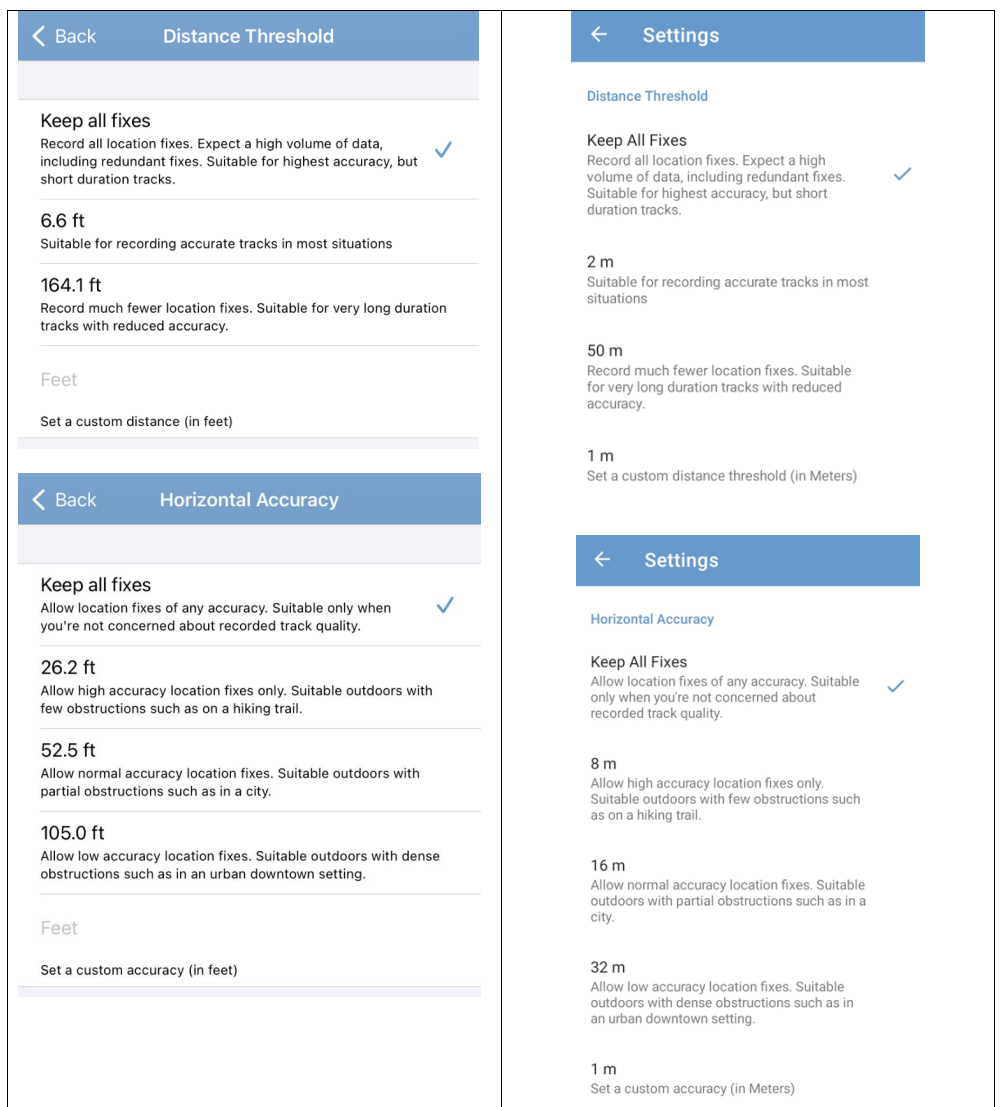
Horizontal Accuracy: “Keep all fixes”
Distance Thresholds: “Keep all fixes”
Time Threshold: “Keep all fixes”
Ignore Suspicious Fixes: Toggled Off
Next, we will set the units to metric. In Settings, navigate to “Units of Measurement” and select “Metric” at the top. Under “Coordinates”, ensure that the “Format” is set to a workable coordinate system.
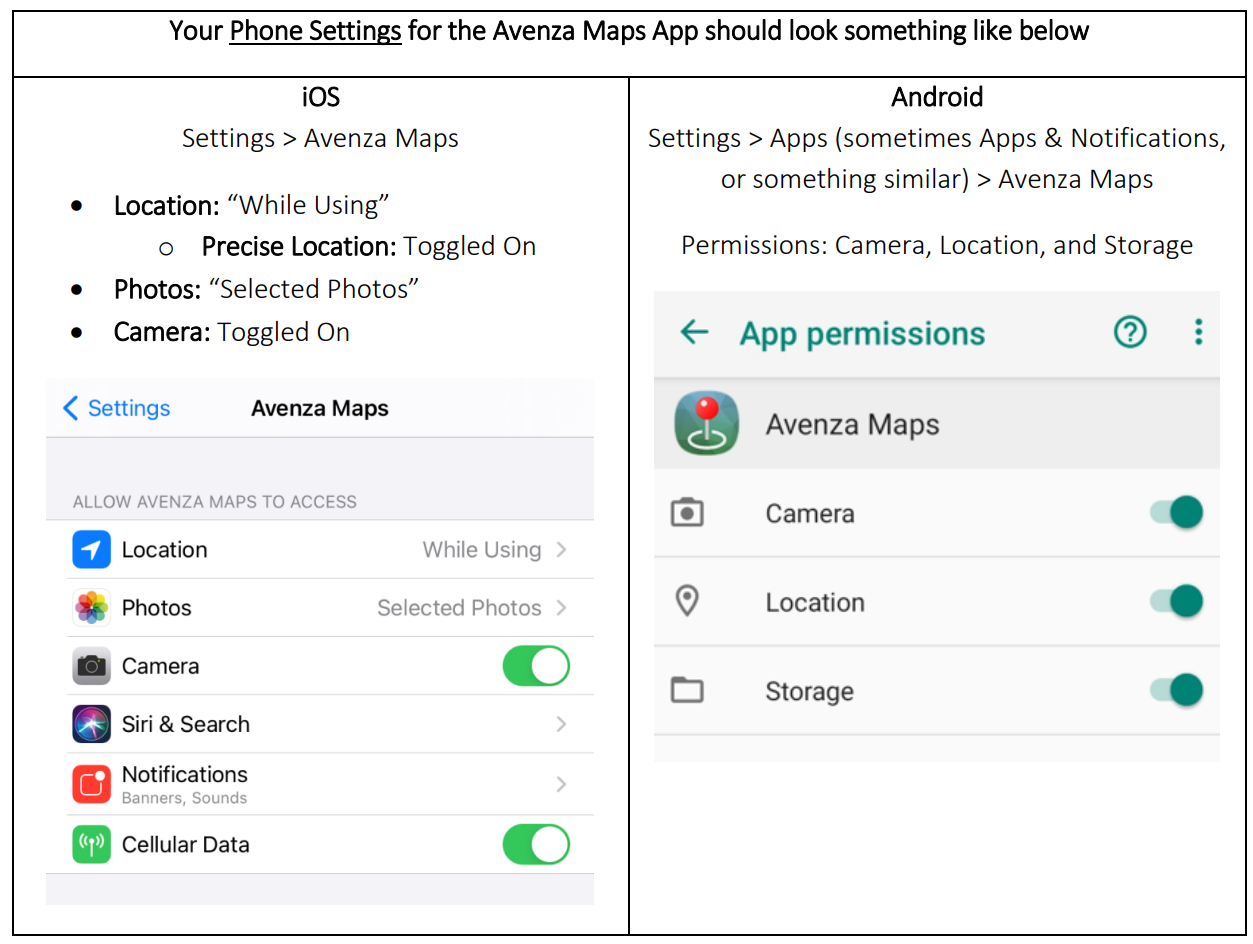
Step 4: Ensure that the Avenza Maps App is allowed to access your location, camera, and photos in your phone’s settings.
Important: Personal location is very sensitive information. You should not undertake this exercise at your home or share the coordinates or screenshots of your home location in Avenza Maps with anyone, including the instructor, TA, or other students in this course. Treat personal location information as any other private sensitive information and handle with respect and care.
Step 5: Avenza Maps requires you to load a map before being able to use the location service of your phone. You will import the georeferenced PDF map that you created in Task 1. There are several ways to do this in Avenza Maps, but probably the easiest is to download the PDF to your phone and then import directly from your phone. Be aware that map size can be large and will consume cellular data if you are not connected to a wifi network. A video on Canvas shows how to accomplish this on iOS using an iPhone and an example georeferenced map of the world.
If you ran into problems creating your georeferenced PDF, then you can use the provided georeferenced PDF on Canvas for the world. In the end, the actual map that you use is not important for collecting your GNSS data, but Avenza Maps requires a georeferenced map be loaded in the app.
Step 6: Travel to your study area!!! Open the Avenza app, and select the Georeferenced PDF under “My Maps.” Go to one of the reference points you selected in ArcGIS. On the bottom right of the app, there is a button that will bring the map to your current area. Press that button, then press the placemark button directly to the right of it. Create a placemark and name it something meaningful (for example: placemark 1, location 1). Stay exactly where you are, and create a placemark every 10 seconds for the next minute by pressing the location button then the placemark. You should have a total of 6 placemarks. Take a picture of the area you are trying to geographically capture. Go to two more of your designated locations and do the same procedure (create 6 placemarks, each 10 seconds apart, and take a picture.
INCLUDE PICTURES OF ALL YOUR REFERENCE POINTS (IN THE FIELD) WITH YOUR FINAL DELIVERABLES (3)
Step 7: Now you can return back to your workstation (after taking a nice walk!). In Avenza, go back to “My Maps,” then select Layers (at the bottom). Select the layer you created, then the icon with three lines at the bottom right. Choose export layers. Export the layer as a KML by pressing the EXPORT option at the top right. A list of export applications should pop up—choose whichever one you would prefer.
Step 8: Find your exported file and bring it into ArcGIS Pro. You can drag and drop it from the Catalog Pane into the main map. From there, you should export the kml file to layer using the tool “KML to Layer.”
Task 3: Assess Precision, Accuracy, and Possible Errors
For this lab, we will consider the initial ArcGIS-created reference points as the “true” values and perform an accuracy assessment with that in mind.
Step 1: Visually compare the Avenza-created Placemarks (called “Observed values” for the rest of the lab) with each other and ArcGIS reference points. How close/far are they from one another? You can use the measure tool to add values to this visual assessment.
TAKE A SCREENSHOT OF YOUR REFERNCE POINTS AND OBSERVED POINTS IN ARCGIS PRO AND INCLUDE IN YOUR DELIVERABLES (5)
When you are comparing the observed values Page 10 of 12 to each other, you are assessing precision, when you are comparing them to the “True” locations, you are assessing accuracy.
Step 2: Quantitatively determine the accuracy of the points. Add two columns in the Observed attribute table and populate them with the east and north values for each point using the Calculate Geometry tool. You should have the True east and north values from your reference points attribute table.
Export both tables as a CSV and bring them into excel.
In excel, we will calculate the horizontal accuracy for each placemark using the following equation:
\(\sigma_{H_{acc}} = \sqrt{(\overline{E} - E_{true})^2 + (\overline{N} - N_{true})^2}\)
Excel is a convenient place to use this equation. Breaking down the equation – get the mean observed East value, then subtract the “True” East value. Square this difference. Do the same for North. Add the north and east results, then take the square root of them. In excel, you can do this with the equation:
=SQRT((average(observed east values)-true east value)^2+((average(observed north values)-true north value)^2))
The resulting value represents how accurate the GNSS measurements were – a lower value represents greater accuracy.
Q3: Is there a noticeable difference in accuracy between your placemarks? Why do you think this is? (3)
To assess the precision, you will use the following equation:
\(\sigma_{H_{pre} = \sqrt{\sigma^2_E + \sigma^2_N}}\)
Calculate the standard deviation of the observed East and North values, square them, then add them and take the square root of the sum. In excel, you can do this with the equation:
=SQRT((STDEV(observed east values)^2 + STDEV(observed values)^2))
The resulting value represents how precise the GNSS measurements were – a lower value represents greater precision.